FFB Week 37: From Data to Deployment: Powering Smarter Broadband Decisions


FFB Week 37: From Data to Deployment: Powering Smarter Broadband Decisions
In a recent Fiber for Breakfast session, Jim Stegeman, President and CEO of CostQuest Associates, shared insights on the current state of U.S. broadband deployment and the evolving role of the FCC’s “fabric” in shaping federal and state funding decisions. With decades of experience developing economic cost models and broadband data tools for the FCC and NTIA, Stegeman has become a trusted voice in policy and industry circles.
“We now have six time periods, so three years of data available from the FCC using the fabric that we provide to understand how broadband is deployed, where the gaps are, and how that information can be used to drive smarter decisions going forward,” Stegeman explained.
The Fabric and Its Impact
The FCC’s Broadband Serviceable Location Fabric has been a game-changer, creating a granular, address-level dataset that underpins the National Broadband Map. According to Stegeman, while the first release had its share of challenges, the fabric has already transformed transparency: “It’s really released a lot of information that we did not have access to before, that I think will just lead to better decisions going forward.”
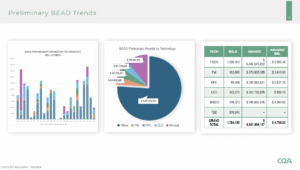 This data has guided the allocation of billions in NTIA Broadband Equity, Access, and Deployment (BEAD) program funding. As of September, 37 states submitted their preliminary funding proposals, with 28 showing early results. Roughly 74% of funding has gone toward fiber builds, covering about 60% of eligible broadband serviceable locations (BSLs).
Fiber Momentum and Market Shifts
Fiber continues to dominate deployment trends. In version six of the FCC dataset, fiber crossed a major milestone—serving more than half of all BSLs in the U.S., or over 62 million locations. Growth has been strong in both urban and rural areas, with 1.5 million new fiber-served locations added in the past six months alone.
Stegeman highlighted surprising success stories like the one in North Dakota: “North Dakota is mostly deployed with fiber, which some people are surprised by, but that’s been North Dakota’s approach—using universal service loans, investment banks, and aggressive strategies to get fiber deployed.”
Nationally, AT&T remains the largest fiber provider, covering about 15% of BSLs, followed by Verizon, Frontier, and Lumen. Meanwhile, smaller regional players are rapidly scaling. In East Alabama, for example, fiber coverage grew nearly 700% over the latest reporting period.
Funding, Technology Mix, and Challenges Ahead
While fiber dominates, low Earth orbit (LEO) satellite networks are carving out a role. Early data shows LEOs accounted for just 5% of funding yet represent 15% of awarded locations—raising questions about long-term service quality and eligibility for future fiber investment.
This creates what Stegeman calls a dilemma: “If you consider LEO a technology for service, then everything is served. If you do not, then we get into the dilemma… How do you then qualify what is served and what is unserved going forward?” For some 800,000 households awarded LEO service, this could mean being permanently excluded from future terrestrial fiber upgrades.
Labor costs also remain a bottleneck for fiber rollouts. With 66–72% of build costs tied to labor, scaling deployment efficiently continues to be an industry challenge.
Looking Ahead
CostQuest has begun releasing its “Broadband in America” reports, analyzing deployment trends over time. Early findings show that the number of underserved BSLs has dropped from 14 million to just 6 million in recent years, thanks to a combination of federal subsidies and private investment.
For Stegeman, the power of the data is not just in measuring progress but in forecasting future builds: “We now have time series data available to understand how deployment across all technologies changes over time… and we’re working on tools to then forecast forward where we think this will continue.”
As state proposals move through NTIA’s review and the next iteration of the FCC fabric is released, industry leaders will have sharper insights into where gaps remain, what technologies are being prioritized, and how the economics of deployment are shifting.
Click here to listen to the full episode or find previous versions of Fiber for Breakfast.
Click here to download the slides.

Related Content

Fiber for Breakfast Week 26: The Quantum Edge – Why Fiber Providers Should Pay Attention Now Quantum networking can sound…

Fiber for Breakfast Week 25: Building AI-Ready Networks: The Next Evolution of Broadband For decades, broadband providers have built networks around people. People streaming video. People working from home. People browsing the…

Fiber Broadband Association Paper Highlights How Convergence of Fiber Broadband and Artificial Intelligence is Reshaping Economic Infrastructure Report explores fiber infrastructure as the “nervous system” of a…