Technical Assessment of LEO Satellite Broadband
Broadband Technologies Review: Technical Assessment of LEO Satellite Broadband
This study examines the capabilities and limitations of Low Earth Orbit (LEO) satellite platforms – using Starlink as a detailed case study – in closing the digital divide in the United States.
The analysis focuses on a single question: What role can LEO play in delivering broadband that meets or exceeds the FCC’s 100/20 Mbps benchmark, today and through 2030?
About the Study
The study evaluates LEO broadband across three dimensions:
-
Technical architecture – how LEO satellite networks work and which elements drive performance.
-
Serviceability at scale – how many U.S. housing units can realistically be served at 100/20 Mbps under capacity constraints.
-
End-user experience – speeds, latency, jitter, reliability, and pricing compared with fiber and fixed wireless access (FWA).
This study is modeled using only information available in the public domain as of November 2024, with minor updates in early 2025. The modeling intentionally takes a conservative approach that is generally favorable to LEO, especially where technical details are incomplete.
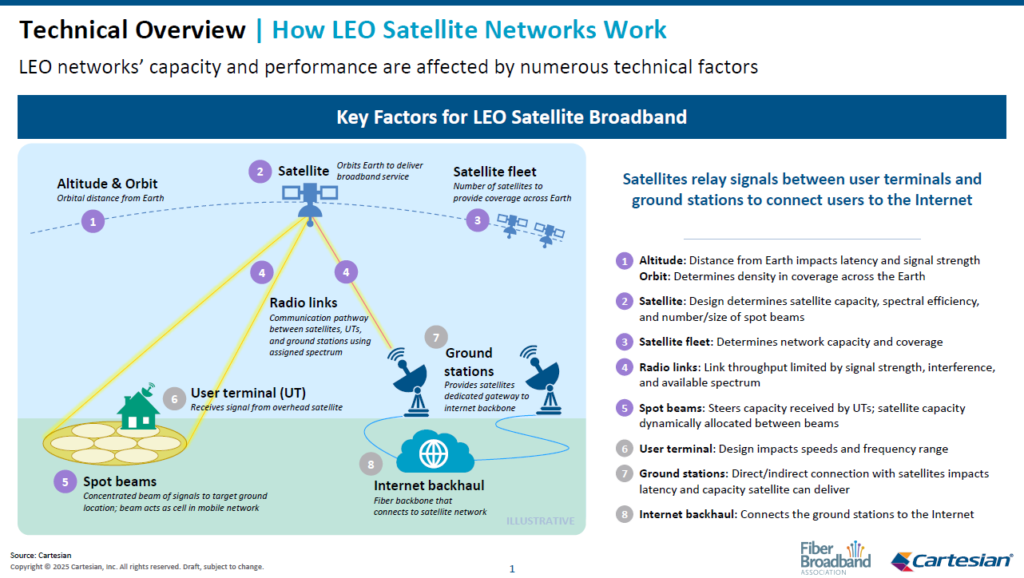
How LEO Satellite Broadband Works
LEO systems consist of thousands of satellites orbiting relatively close to Earth, user terminals on the ground, radio links that connect users to satellites, and ground stations that tie the satellite network into the internet backbone.
Key technical factors that influence capacity and performance include:
-
Altitude and orbit – lower orbits reduce latency but require many more satellites to maintain coverage.
-
Satellite design and fleet size – determine total network throughput and coverage.
-
Radio spectrum and spot beams – finite spectrum is divided into “cells” on the ground; each cell has a maximum capacity that must be shared by all users in that area.
-
User terminals and ground stations – influence achievable speeds, latency, and resilience.
Because each satellite’s capacity and each cell’s spectrum are shared, subscriber density and traffic patterns directly affect the speeds that end user’s experience.
Key Finding 1: Capacity Is Real but Limited
The study estimates how many U.S. housing units (HUs) Starlink can serve with a 100/20 Mbps service, considering both total fleet capacity and spectrum available per cell.
-
Today
-
Approximate maximum of 2.0 million U.S. housing units can be supported at 100/20 Mbps.
-
This includes about 1.4 million current U.S. subscribers, leaving capacity for roughly 0.6 million incremental housing units.
-
Spectrum allocations limit Starlink to about 114 housing units per cell, or roughly 1 housing unit per square mile in the contiguous U.S., if 100/20 Mbps is to be maintained.
-
-
By 2030
-
With a larger fleet, higher-capacity satellites, improved spectral efficiency, dual polarization, and full use of authorized Ku/Ka spectrum, Starlink’s network could support up to 7.3 million housing units at 100/20 Mbps.
-
However, spectrum becomes the limiting factor, capping serviceable locations at about 5.5 million U.S. housing units, or roughly 3 housing units per square mile.
-
Assuming a forecast of 4.2 million U.S. residential subscribers in 2030, that leaves capacity for about 1.3 million additional subscribers.
-
These figures represent theoretical upper bounds, assuming demand is evenly distributed. In practice, concentrations of demand in certain cells – such as suburbs or exurban areas – will reduce the number of locations that can be served with 100/20 Mbps without degrading performance.
Key Finding 2: LEO’s Role in BEAD and Rural Deployments
The study overlays Starlink’s capacity on the population of BEAD-eligible locations (areas without low-latency 100/20 Mbps wireline or licensed FWA service). There are approximately 7.4 million BEAD-eligible housing units in the U.S. (excluding Alaska, Hawaii, and territories).
Under current conditions and assuming optimal distribution:
-
Today
-
Starlink could potentially serve about 559,000 BEAD-eligible housing units, combining existing and incremental subscribers – roughly 8 percent of the BEAD-eligible total.
-
-
By 2030
-
That number could grow to roughly 1.3 million BEAD-eligible housing units, or around 18 percent of the BEAD-eligible total, if capacity improvements materialize and BEAD-eligible locations are prioritized.
-
Because LEO capacity per cell is limited, the study finds that LEO is best positioned as a targeted solution for the most isolated and highest-cost locations – places where fiber construction or dedicated FWA build-outs are prohibitively expensive or physically challenging. In more densely clustered BEAD areas, terrestrial solutions often remain more scalable and cost-effective.
Key Finding 3: LEO Performance Lags Behind Fiber and Fixed Wireless
The study compares LEO network performance with fiber and FWA using median delivered speeds, latency, jitter, and uptime.
-
Speeds
-
Typical median downloads:
-
Fiber: ~349 Mbps
-
FWA: ~210 Mbps
-
LEO (Starlink): ~104 Mbps
-
-
As median values, this means speeds are below 100 Mbps in at least half of LEO cases, putting many locations under the FCC’s 100/20 Mbps benchmark even today.
-
-
Latency and Jitter
-
LEO latency is significantly lower than GEO but still roughly 13 times higher than fiber, and jitter can be up to 80 times worse, which can impair real-time applications such as video conferencing and interactive cloud services.
-
-
Reliability
-
Fiber networks can routinely achieve 99.99 percent uptime (less than 0.1 outage hours per month), while LEO services typically show lower availability due to atmospheric conditions, obstructions, and the complexity of handoffs between satellites.
-
Looking ahead to 2030, the study notes that fiber networks are expected to offer mass-market tiers up to 20 Gbps, while even next-generation LEO systems are targeting speeds of around 1 Gbps, with potential 2 Gbps offerings not yet defined in terms of timing or coverage.
Key Finding 4: LEO has Higher Costs per Mbps for Consumers
On both upfront and recurring charges, LEO broadband is currently more expensive than fiber and FWA:
-
Monthly pricing
-
Residential LEO service averages around $120 per month, with a significantly higher price per Mbps than comparable fiber or FWA plans.
-
-
Upfront costs
-
LEO customers typically face equipment and installation costs that can reach approximately $448 or more, while many fiber and FWA providers either waive installation fees or offer substantially lower equipment costs.
-
Taken together, fiber and FWA provide higher and more reliable performance at a lower cost per Mbps for most consumers wherever those technologies are available.
What This Means for Policymakers and Providers
The study’s overall conclusion is that LEO satellite broadband is an important complementary technology, not a substitute for robust terrestrial broadband.
-
Where fiber or licensed FWA can be deployed economically, they remain the superior choice in terms of capacity, quality of experience, and long-term scalability.
-
LEO is strategically valuable for the “last, hardest-to-reach” locations, where extreme distance, terrain, or very low density make terrestrial deployments uneconomic – and where a limited pool of LEO capacity can have outsized impact if carefully targeted.
For federal and state broadband programs, this analysis underscores the need to:
-
Align technology choices with long-term capacity and performance needs, not just initial coverage.
-
Use LEO selectively in sparsely populated, geographically isolated areas, preserving finite satellite capacity while maximizing BEAD impact.
-
Continue investing in fiber-first strategies where feasible, ensuring communities can scale to multi-gigabit services and next-generation applications.
Access the Full Materials
This webpage provides a high-level overview of the Broadband Technologies Review: A Technical Assessment of Low Earth Orbit Satellite Broadband, prepared by Cartesian for the Fiber Broadband Association.
-
Download the full technical report for detailed modeling assumptions, methodology, and state-by-state estimates.
-
Download the executive summary for a concise overview of capacity, performance, and policy implications.